Your bloodwork. Your health. Your control.
Standard lab reference ranges are built for normal people, not enhanced athletes. Elevated creatinine from high muscle mass isn't kidney failure. A high AST after heavy training isn't liver damage. VitalMetrics uses PED-adjusted ranges and AI that understands the difference.
Why standard bloodwork tools fail enhanced athletes
The problem
Lab reference ranges are based on sedentary, non-enhanced populations. You see a red “H” flag and panic, but it might be completely normal for someone with your muscle mass and protocol.
Why it matters
Panicking over normal-for-you values leads to unnecessary stress, protocol changes, or ignoring bloodwork altogether. Genuinely concerning markers get lost in the noise.
The solution
VitalMetrics uses bodybuilder-adjusted reference ranges, tracks trends over time (not just snapshots), and provides personalised insights that understand PED context, so you know what actually matters.
Built for enhanced athletes, not the average GP patient
Standard health tools don't understand PED context. VitalMetrics does.
PDF Blood Test Parsing
Upload your blood test PDF or photo and markers are automatically extracted and stored.
Personalised Insights
Ask about your bloodwork and get insights that understand PED context, not generic GP advice that ignores what you're running.
Marker Trends & History
Track every blood marker over time with interactive charts and trend indicators.
Compound Timeline
Log your cycles with a visual timeline overlay to correlate compounds with blood markers.
Smart Flagging
Stop panicking over creatinine and AST. PED-adjusted reference ranges flag what actually matters and ignore what doesn't.
Harm Reduction Focused
Educational tool built for harm reduction, not medical advice, but better awareness.
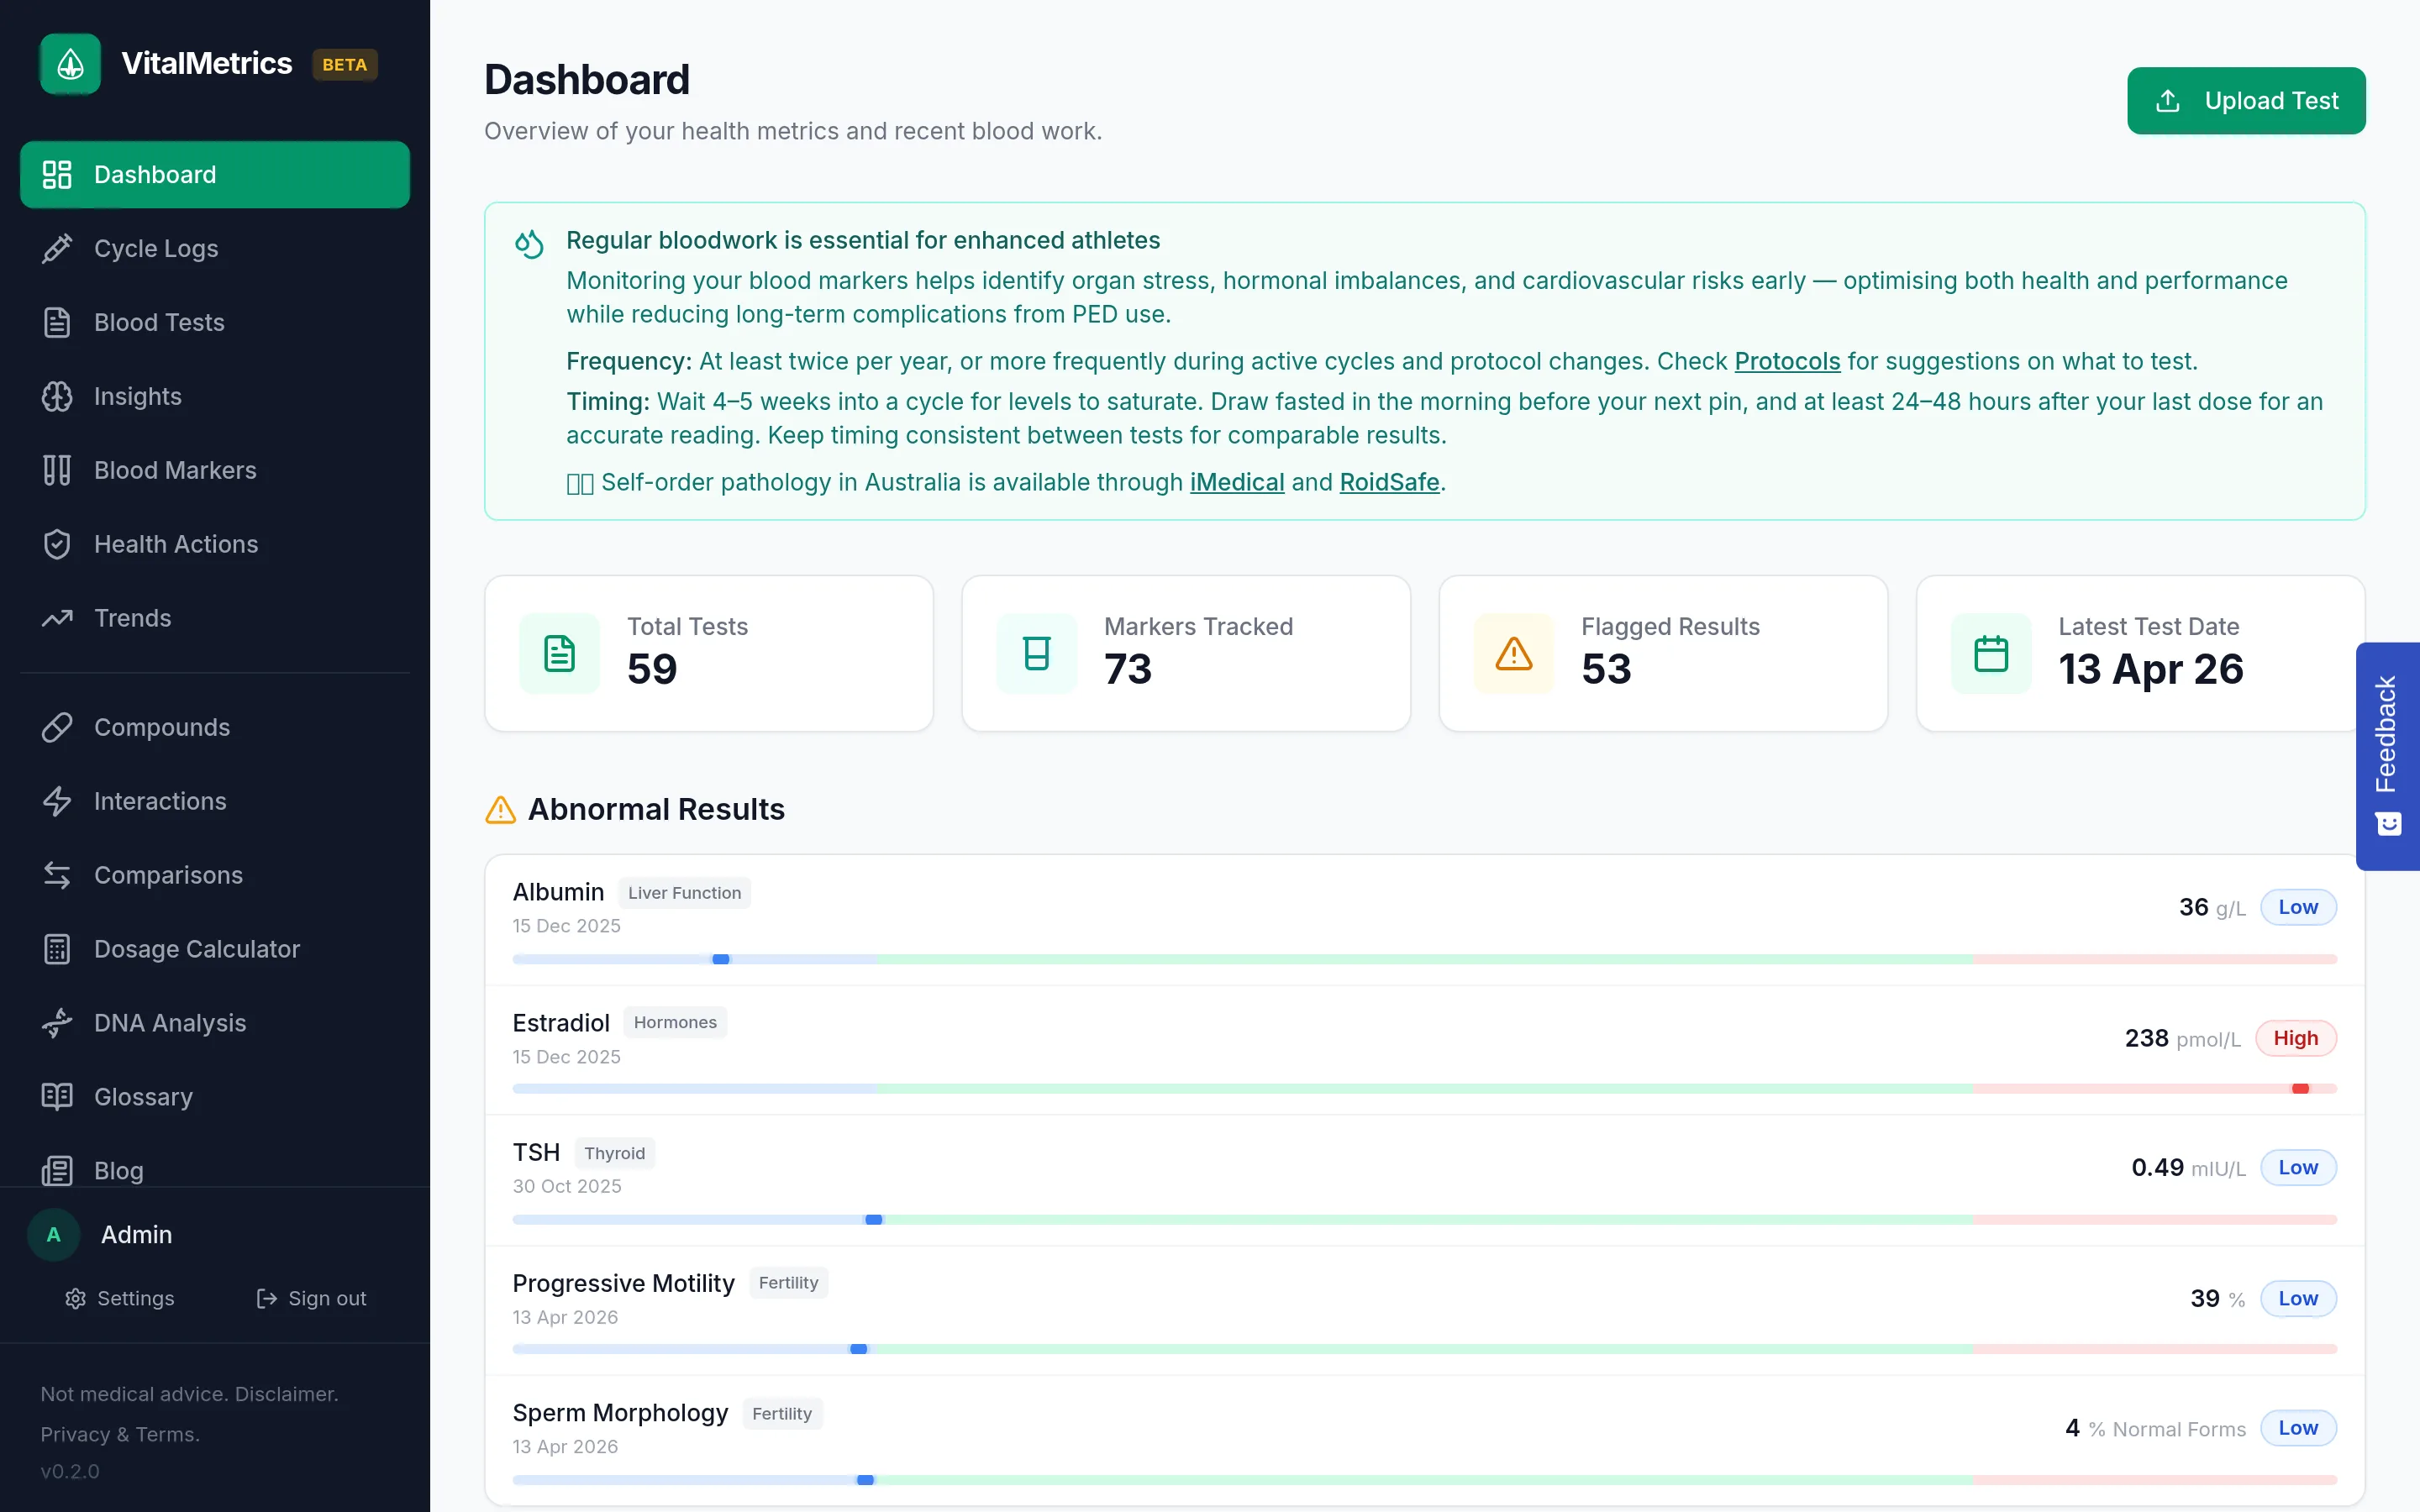
See it in action
Overview of your health metrics, key markers, and trends at a glance.
How it works
Upload your bloods
Upload a blood test PDF or photo. Markers are extracted automatically.
Get personalised insights
Review a clinical breakdown with PED-aware context and actionable recommendations.
Track and improve
Monitor trends over time and correlate with your compound timeline.
From the blog
Our most popular guide
Built by an athlete, for athletes
Why I built VitalMetrics
I'm Bruno, IFBB competitor and the person behind VitalMetrics. After years of getting bloodwork done and struggling to make sense of results through a PED lens, I got tired of GPs telling me my creatinine was “concerning” when it was just my muscle mass, or panicking over AST the day after a heavy squat session.
I wanted a tool that actually understood the context. One that could tell the difference between a genuinely dangerous marker and a perfectly normal result for an enhanced athlete. Something that tracked trends over time instead of reacting to single snapshots. That's VitalMetrics.
This isn't medical advice and never will be. It's a harm-reduction tool built by someone who actually uses it. If you're serious about your health and your training, your bloodwork deserves better than generic lab ranges built for people who don't lift.
Free During Beta
We're looking for athletes and coaches to test VitalMetrics and help shape the product. All features are free while we're in beta.
All Features Included
Full access to every feature while we're in beta. Help us build the best health tracking tool for athletes.
- Manual blood test entry
- PDF/image upload & auto-extraction
- Dashboard & key markers
- Marker history & trend charts
- BB-adjusted reference ranges
- AI clinical analysis
- Health actions & recommendations
- Protocol generation
- Compound logging & timeline
- Compound timeline overlay on trends
- Dosage calculator
- Glossary
No credit card required. No invite code needed.
Take control of your health data
Stop comparing your bloodwork to normal people. Know what actually matters.